
Guiding Your Asset Replacement Decisions with EAM Software
Replacement decisions are easy to defer. Each individual repair appears cheaper than replacement, and, individually, each one often is. The problem is that repairs accumulate over time. Without a system tracking the running total, the cumulative total is never fully visible. As a result, the point at which replacement becomes the better financial option passes unnoticed.
Enterprise asset management (EAM) software changes this by calculating the running cost of each asset over time. LLumin’s computerized maintenance management system software (CMMS+) goes even further, linking every work order cost (e.g. labor, parts, downtime) to the relevant asset. This approach builds a running record of total lifetime spend and makes maintenance vs replacement costs comparable in practice rather than in theory.
Try LLumin CMMS+ online for free to see how EAM data applies to your asset replacement planning.
How EAM Data Guides When To Replace Equipment
Most operations answer the question of when to replace equipment reactively. Eventually, assets fail catastrophically, replacement becomes unavoidable, and the decision gets made under pressure. EAM asset replacement decisions made proactively, however, produce better outcomes for both cost and operational continuity.
Shows When Repair Costs Are No Longer Justified
The most direct input into a replacement decision is the asset’s cumulative repair cost. When that figure is visible, your teams can compare maintenance and replacement costs. More acutely, they can identify the point where continued repair is no longer the rational financial choice.
ReadyAsset builds this record automatically, capturing every maintenance cost against the asset where it was performed. Over time, that record reveals whether costs are stable, trending upward, or spiking unpredictably. In this way, a CMMS creates maintenance cost savings by making evidence-based replacement decisions possible.
Highlights Assets With Repeated Failures
Cumulative cost is only one dimension of the replacement decision. It’s also important to consider how often a given asset breaks down. Assets with moderate costs and frequent repair histories can cost more than those with high costs but infrequent breakdowns. Moreso, frequent repairs often reflect structural issues your team has to deal with. Manual repair systems leave this process largely to the guesswork of your technicians.

CMMS software helps reduce equipment failure rates by making these patterns visible. Failure records aggregated by asset reveal which equipment generates disproportionate reactive demand. From there, teams can prioritize assets for preventive maintenance based on criticality, providing a linear sense of what’s causing the most damage.
Tracks Performance Decline Over Time
Cost and failure frequency measure what maintenance has responded to. By contrast, performance data measures what the asset is actually delivering. This distinction becomes especially critical when assessing asset health over time, as natural wear and tear becomes a serious evaluation factor.
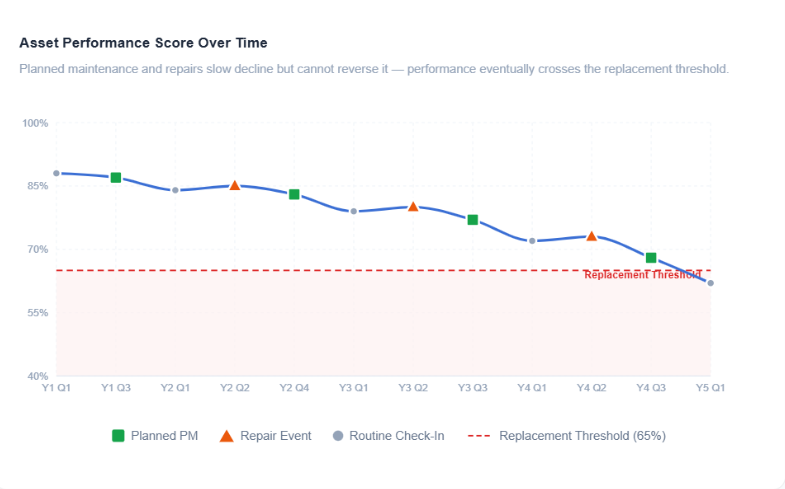
OEE monitoring continuously tracks the downward trends that indicate equipment approaching the end of its viable lifecycle, such as:
- Availability dropping below baseline as unplanned downtime becomes more frequent
- Performance rate declining as cycle times lengthen and minor stops accumulate
- Quality rate falling as defect and rework rates trend upward quarter over quarter
Predictive maintenance lifecycle management connects that data to replacement planning. That means that consistent declines that are not reversed by maintenance result in stronger consideration of replacement. Teams will be able to make more defensible and better-timed asset lifecycle management decisions than is possible with subjective judgments.
Compares Maintenance Cost Against Asset Value
The maintenance vs replacement cost comparison is incomplete without accounting for what the asset is worth. An asset with significant remaining value, for example, warrants a different cost threshold for replacement than one that is peripheral or redundant. Similarly, an asset central to production has different spending considerations than a component of several interchangeable units.
Maintenance data can also help companies increase asset resale value, should they decide to replace an asset while it still has value. Assets with complete, well-maintained service records command better residual value, which changes the replacement equation. Teams can use historical and condition-based data to support an accurate assessment of the asset’s current value.
Supports Long-Term Replacement Planning
Arguably, the greatest benefit of EAMs is that they allow managers to start thinking long term. The most operationally and financially effective equipment replacement strategy is one planned in advance. Reactive replacements cost 3-5x more on average. In addition, they disrupt operations and offer less opportunity for capital optimization than replacements forecasted, budgeted, and sequenced based on asset data.
EAM software allows teams to analyze cost trajectories by:
- Asset
- Failure Rate Trends
- Performance Curves
- Maintenance History
It also helps them plan to extend asset performance using preventive maintenance programs. These tools identify how much life extension is achievable before decline becomes irreversible. This informs both when to stop investing in extension and when to begin planning for replacement. In this way, it ensures that managers can extend asset lifespan and manage replacement decisions from the same data source.
How LLumin Helps You Optimize Asset Replacement Planning
LLumin connects every cost, failure event, and performance record to the specific asset that generated it. This ensures your teams are working from a single longitudinal record that combines:
- A Complete Asset Cost History: Every work order, part, and labor hour tied to that asset, so cumulative repair spend is visible at a glance rather than calculated manually
- OEE And Performance Trend Tracking: Allows teams to see performance trends over time and ties those trends directly to replacement thresholds
- MTBF And MTTR Visibility: Shows where failure intervals are shortening or repair times are growing, signaling assets consuming more than they contribute.
- Automated Replacement Alerts: Displays when an asset crosses predefined costs or thresholds, so replacement decisions are flagged before the consequences of deferral arrive.
The financial outcome of getting these decisions right is significant. Operations that implement EAM consistently achieve up to 15% in annual maintenance savings. This is, in part, because assets are replaced before they consume disproportionate repair resources. It also allows capital planning to become proactive rather than reactive.
Make Strategic Asset Replacement Decisions With LLumin CMMS+
EAM asset replacement decisions are easy to make with the correct data. The challenges in most operations include tracking aggregate repair costs, incomplete performance records, and siloed failure history data. The result is replacement decisions made on intuition, visible failure events, or budget-cycle pressure.
LLumin’s EAM platform solves the data problem directly. Every cost, failure event, and performance record is automatically connected to the asset that generated it. This builds the longitudinal record that replacement decisions depend on as assets accumulate history over time. By the time a replacement decision is warranted, the data to support it already exists. Teams looking to extend this capability can find a framework in AI in maintenance management.
Try LLumin CMMS+ online for free to see how EAM asset replacement decisions apply to your specific asset base and capital planning process.
Frequently Asked Questions
When Should Equipment Be Replaced Instead Of Repaired?
The most widely used threshold is the 50% rule. This states that when an asset’s cumulative repair costs reach 50% of its replacement value, replacement is generally the stronger financial decision. That threshold can be lower for assets with high downtime risk or where performance degradation compounds production losses faster than repair costs accumulate.
Finding that requires looking at three inputs over time:
- Current performance against specification
- Cumulative repair cost as a percentage of replacement value
- Failure frequency over a defined period
How Does EAM Help With Asset Replacement Decisions?
EAM asset replacement decisions eliminate guesswork by making the repair vs replace comparison factual. Every work order cost is attributed to the specific asset on which it was performed. Similarly, every failure event is recorded with context for fault type, severity, response, and outcome. Finally, every performance measurement is logged against the asset’s history. Over time, those records build a picture of asset lifecycle management that makes replacement timing visible long before an emergency forces the issue.
What Data Is Needed To Plan Asset Replacement?
The three essential asset replacement decision inputs are:
- Cumulative Maintenance Cost: What has been spent on this asset over its lifetime?
- Failure Frequency and Pattern: How often does it break? Do the failures indicate a structural problem?
- Current Performance Relative To Specification: Is the asset delivering its intended output?
EAM implementation that prioritizes asset-level cost tracking and performance monitoring from the start builds this foundation over time. In effect, this makes long-term replacement planning possible as the historical record deepens.
How Do You Compare Maintenance Cost Vs Replacement Cost?
A maintenance vs replacement cost comparison works when cumulative maintenance spend is tracked per asset rather than in aggregate. Once the total cost of maintaining a specific asset is visible, it can be set against the cost of acquiring, installing, and commissioning its replacement. This includes any operational disruption the replacement process involves.
What Are The Signs An Asset Should Be Replaced?
Look for repair costs trending upward without a corresponding improvement in reliability, and for failure frequency to increase despite recent maintenance. In addition, keep an eye out for performance data that consistently falls below specification and parts that are becoming difficult to source. Both CMMS and EAM software can track these indicators, but the scale and complexity of the asset base matter. In either case, equipment replacement strategy decisions are only as reliable as the asset records that support them.

Chris Palumbo brings over 13 years of expertise in B2B sales across diverse sectors including Manufacturing, Food and Beverage, Packaging, and Pharmaceuticals. Leveraging 6 years of leadership experience, Chris has successfully guided sales teams within Manufacturing and Distribution to achieve success, particularly in large capital expenditure projects. As Director of Business Development for LLumin, Chris oversees the identification of business opportunities, pushing the development and implementation of a robust business development strategy aimed at accelerating revenue growth. With a proven track record of excellence, Chris has established himself as a respected industry leader and invaluable asset to the LLumin team.