Track and Improve MTTR Across Your Enterprise with EAM
Industry average MTTR has nearly doubled since 2019. For most multi-site operations, the challenge isn’t just that repair times are rising, but that the data used to measure them aren’t consistent across locations. Before you can make meaningful improvements, you need to trust what the number is actually telling you.
That’s where LLumin CMMS+ comes in. By standardizing how repair time is tracked, logged, and reported across every site, LLumin gives your team the foundation to act on MTTR data.
MTTR Is Easy to Measure but Difficult to Manage at Scale
On a single site with one team and one CMMS, tracking MTTR is a reasonably straightforward equation: total repair time divided by number of repairs. It works like this:
Say a plant ran five corrective repairs last month totaling 20 hours. The repairs took 2, 3, 5, 4, and 6 hours, respectively. MTTR would be calculated using the following formula:
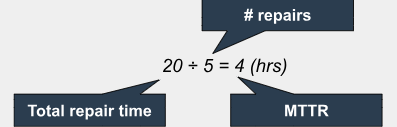
That number is meaningful because every technician on that team closes work orders the same way: the clock starts at the failure notification and stops at confirmed restoration.
As long as technicians are consistently logging work orders, the number reflects reality. Across multiple sites, that consistency breaks down: they start the clock at different points, close work orders inconsistently, and, as a result, the resulting MTTR figures look comparable on a dashboard but aren’t.
Inconsistent time tracking can skew MTTR by ±50%, which means you are making decisions based on cross-site MTTR comparisons and are often working from numbers that don’t mean the same thing.
Manufacturing MTTR Benchmarks
| Performance Level | Discrete Mfg | Process Mfg |
|---|---|---|
| World-class | 2-3 hours | 3-4 hours |
| Industry average | 4-6 hours | 5-8 hours |
| Below average | 8+ hours | 10+ hours |
| Industry avg. trend (2019–2024) | +65% (49 → 81 min) | +65% (49 → 81 min) |
| Top-quartile vs. avg. | 60% lower MTTR | 60% lower MTTR |
LLumin CMMS+ provides consistency in how repair time is tracked, giving leaders a clear, reliable view across the enterprise.
MTTR Tracking Becomes Inconsistent Without an EAM
Think about how most multi-site operations actually track repair time without a standardized platform.
- Site A has technicians who fill in work orders at the end of a shift from memory.
- Site B uses paper logs that someone enters into a spreadsheet weekly.
- Site C has a CMMS, but the timestamp that fires at work order creation doesn’t match when the repair actually starts.
None of these numbers is wrong exactly, but they’re measuring different things. Online MTTR calculators are a great place to start, but the only real way to accurately measure MTTR is by using a CMMS or EAM with proper workflows and timestamps that collect data from multiple sources. Without that structure, data looks comprehensive but can’t support meaningful comparison or improvement decisions.
How EAM Helps You Track and Improve MTTR Across Your Enterprise
Now that you understand the challenges of calculating MMTR across multiple sites, let’s explore how to improve MTTR with EAM software, both from a reporting perspective and through implementation.
Standardizes How MTTR Is Measured Across Sites
Before you can improve MTTR with EAM, you need every site to generate the same number in the same way. LLumin CMMS+ enforces consistent work order lifecycle stages across operations (e.g., failure notification, assignment, diagnosis start, repair start, completion, and closure), each with an automatic timestamp captured at the moment the status changes.
Makes Delays Visible Across the Full Repair Process
Most organizations track MTTR as a single number: total repair time, start to finish. That number, however, hides where the time is actually going. Consider this:
| A work order catalogs a 6-hour MTTR. Upon closer inspection, a manager finds that the work order only records 30 minutes of active repair work, leaving 5.5 hours of unreported waiting (e.g., waiting for a technician to be dispatched, waiting for a part to be located, waiting for a supervisor to sign off). |
Until you can see the full repair timeline broken into phases, you’re trying to reduce a number without knowing which component of it is driving the problem. EAM captures the timestamp at each stage of the repair process, making the full timeline visible rather than summarized.
| After upgrading to a CMMS with EAM capabilities, that same manager observes a new work order and finds that the: Detection → report: 15-60min Report → assignment: 25-30min Assignment → repair start: 2hr Active repair: 2-3hr Completion → closure: 1hr As a result, they can schedule future repairs more effectively. |
LLumin’s reporting dashboards surface where time is concentrated across the enterprise, whether the bottleneck is in detection, assignment, parts access, or execution. This ensures improvement efforts go where the time is actually being lost.
Connects Repair Performance to Assets, Teams, and Locations
MTTR at the enterprise level tells you how the overall program is performing. What it doesn’t tell you is whether the problem is a specific asset class, a specific site, or a specific crew.
LLumin’s ReadyAsset links every work order to a specific asset, technician, site, and failure mode, so MTTR can be segmented by any combination of those dimensions. This ensures that assets with a consistently high MTTR get identified while underperforming ones get surfaced. Teams where downtime patterns are revealed suggest training gaps that need to be addressed.
Improves Coordination Between People, Parts, and Work
A significant share of MTTR actually just comes down to coordination time, and it happens more than even seasoned technicians realize:
- A technician who can’t start because the part isn’t staged.
- A work order that sat unassigned for three hours because the right crew wasn’t notified.
- A handover between shifts that lost 45 minutes because the incoming technician didn’t have the repair history.
LLumin CMMS+ connects work order assignment, parts availability, and technician scheduling in a single system. It also keeps on-prem technicians aligned with mobile CMMS access, putting repair history, procedures, and parts location in the technician’s hands before they reach the asset.
Supports Enterprise-Wide Reporting and Continuous Improvement
Tracking MTTR without reviewing it systematically delivers no improvement value. Organizations with standardized processes achieve 28% lower MTTR.
However, standardization alone isn’t enough if the data isn’t being used to drive targeted action; the compounding benefit of enterprise maintenance performance tracking through EAM is that every repair adds to a dataset that gets more useful over time. For operations running 25 unplanned downtime incidents per month, the compounding math on even modest MTTR improvement is significant:
MTTR Improvement Compounding Value (Assuming 25 incidents/month)
| If you reduce MMTR by… | …You save _ hours per month… | …And see _% improvement in OEE |
|---|---|---|
| 10% | 12-15 | ~4-6% |
| 20% | 25-30 | ~8-12% |
| 30% | 37-45 | 12-18% |
| 60% | 75+ | Material |
LLumin’s enterprise dashboards make that math visible and trackable across sites, over time, and against defined targets. If you want to see what a 10-30% MTTR reduction would mean for your operation specifically, LLumin’s free demo is the fastest way to find out.
How LLumin CMMS+ Enables Consistent MTTR Improvement
To improve MTTR with EAM, focus on connecting what’s currently fragmented: having a tool at your disposal that brings together your disconnected systems ensures that your teams work with reliable data across every site. LLumin CMMS+ brings those elements together so that enterprise maintenance performance tracking produces numbers worth acting on and improvement programs worth sustaining.
For a deeper look at how EAM compares to standalone CMMS for enterprise maintenance tracking, the EAM vs CMMS guide and EAM implementation resources provide practical context for planning your approach.
Track and Improve MTTR with LLumin
Improving MTTR with EAM is about removing the coordination delays, data gaps, and workflow inconsistencies that inflate repair time before active work even starts. When every site measures MTTR the same way and that data feeds a shared reporting system, improvement becomes targeted, trackable, and sustainable across the enterprise.
Book your free demo to see how LLumin CMMS+ helps you track MTTR and drive meaningful improvement across every site. Use the MTTR ROI calculator to quantify what closing the gap between your current MTTR and world-class benchmarks is worth for your operation.
Frequently Asked Questions
What is MTTR in maintenance?
MTTR (Mean Time to Repair) is a maintenance KPI that measures the average time required to restore a failed asset to full operational status. It’s calculated by dividing total repair time by the number of repairs over a defined period. It’s one of the core metrics for assessing maintenance efficiency; a lower MTTR means faster recovery, higher availability, and lower downtime cost.
How do you track MTTR across multiple sites?
Reliable enterprise maintenance performance tracking for MTTR requires three things:
- Standardized work order lifecycle stages
- Automatic timestamp capture at each stage
- A shared platform that aggregates data from all sites in the same format.
Without all three, each site calculates MTTR using different start and end points and different time-logging methods. As a result, numbers aren’t comparable across sites. The only way to accurately measure MTTR is to use a CMMS or EAM with a proper workflow and timestamps that collect data from multiple sources.
Why is MTTR hard to improve at scale?
At scale, MTTR improvement faces two compounding challenges.
- Measurement: If sites aren’t measuring MTTR the same way, you can’t tell whether a gap between locations reflects a real performance difference or just a data difference. Inconsistent time tracking can significantly skew MMTR, which means improvement programs built on that data are working from faulty baselines.
- Attribution: Even with clean data, understanding what’s driving MTTR at a specific site requires the ability to segment by asset, technician, shift, failure mode, and parts availability. Without that analytical depth, improvement efforts apply generic fixes to specific problems and see limited results.
What affects mean time to repair?
MTTR is shaped by factors throughout the full repair timeline, not just the active repair phase.
- Testing and documentation
- Detection and notification speed
- Technician response and dispatch time
- Parts availability at the time of repair
- Technician skill
- Access to repair procedures
- Asset complexity
How does EAM help improve MTTR?
Improve MTTR with EAM by standardizing the measurement methodology to ensure MTTR is trustworthy, then providing the workflow and data tools to remove delays at each phase of the repair cycle.
- Standardized work order workflows and automatic timestamps ensure every site measures MTTR consistently.
- Integrated asset history reduces diagnosis time by putting failure records and repair procedures in the technician’s hands at the start of the job.
- Connected parts management reduces the coordination overhead that inflates repair time before active work begins.
- Enterprise dashboards surface where improvement efforts will have the most impact across the fleet.

Chris Palumbo brings over 13 years of expertise in B2B sales across diverse sectors including Manufacturing, Food and Beverage, Packaging, and Pharmaceuticals. Leveraging 6 years of leadership experience, Chris has successfully guided sales teams within Manufacturing and Distribution to achieve success, particularly in large capital expenditure projects. As Director of Business Development for LLumin, Chris oversees the identification of business opportunities, pushing the development and implementation of a robust business development strategy aimed at accelerating revenue growth. With a proven track record of excellence, Chris has established himself as a respected industry leader and invaluable asset to the LLumin team.